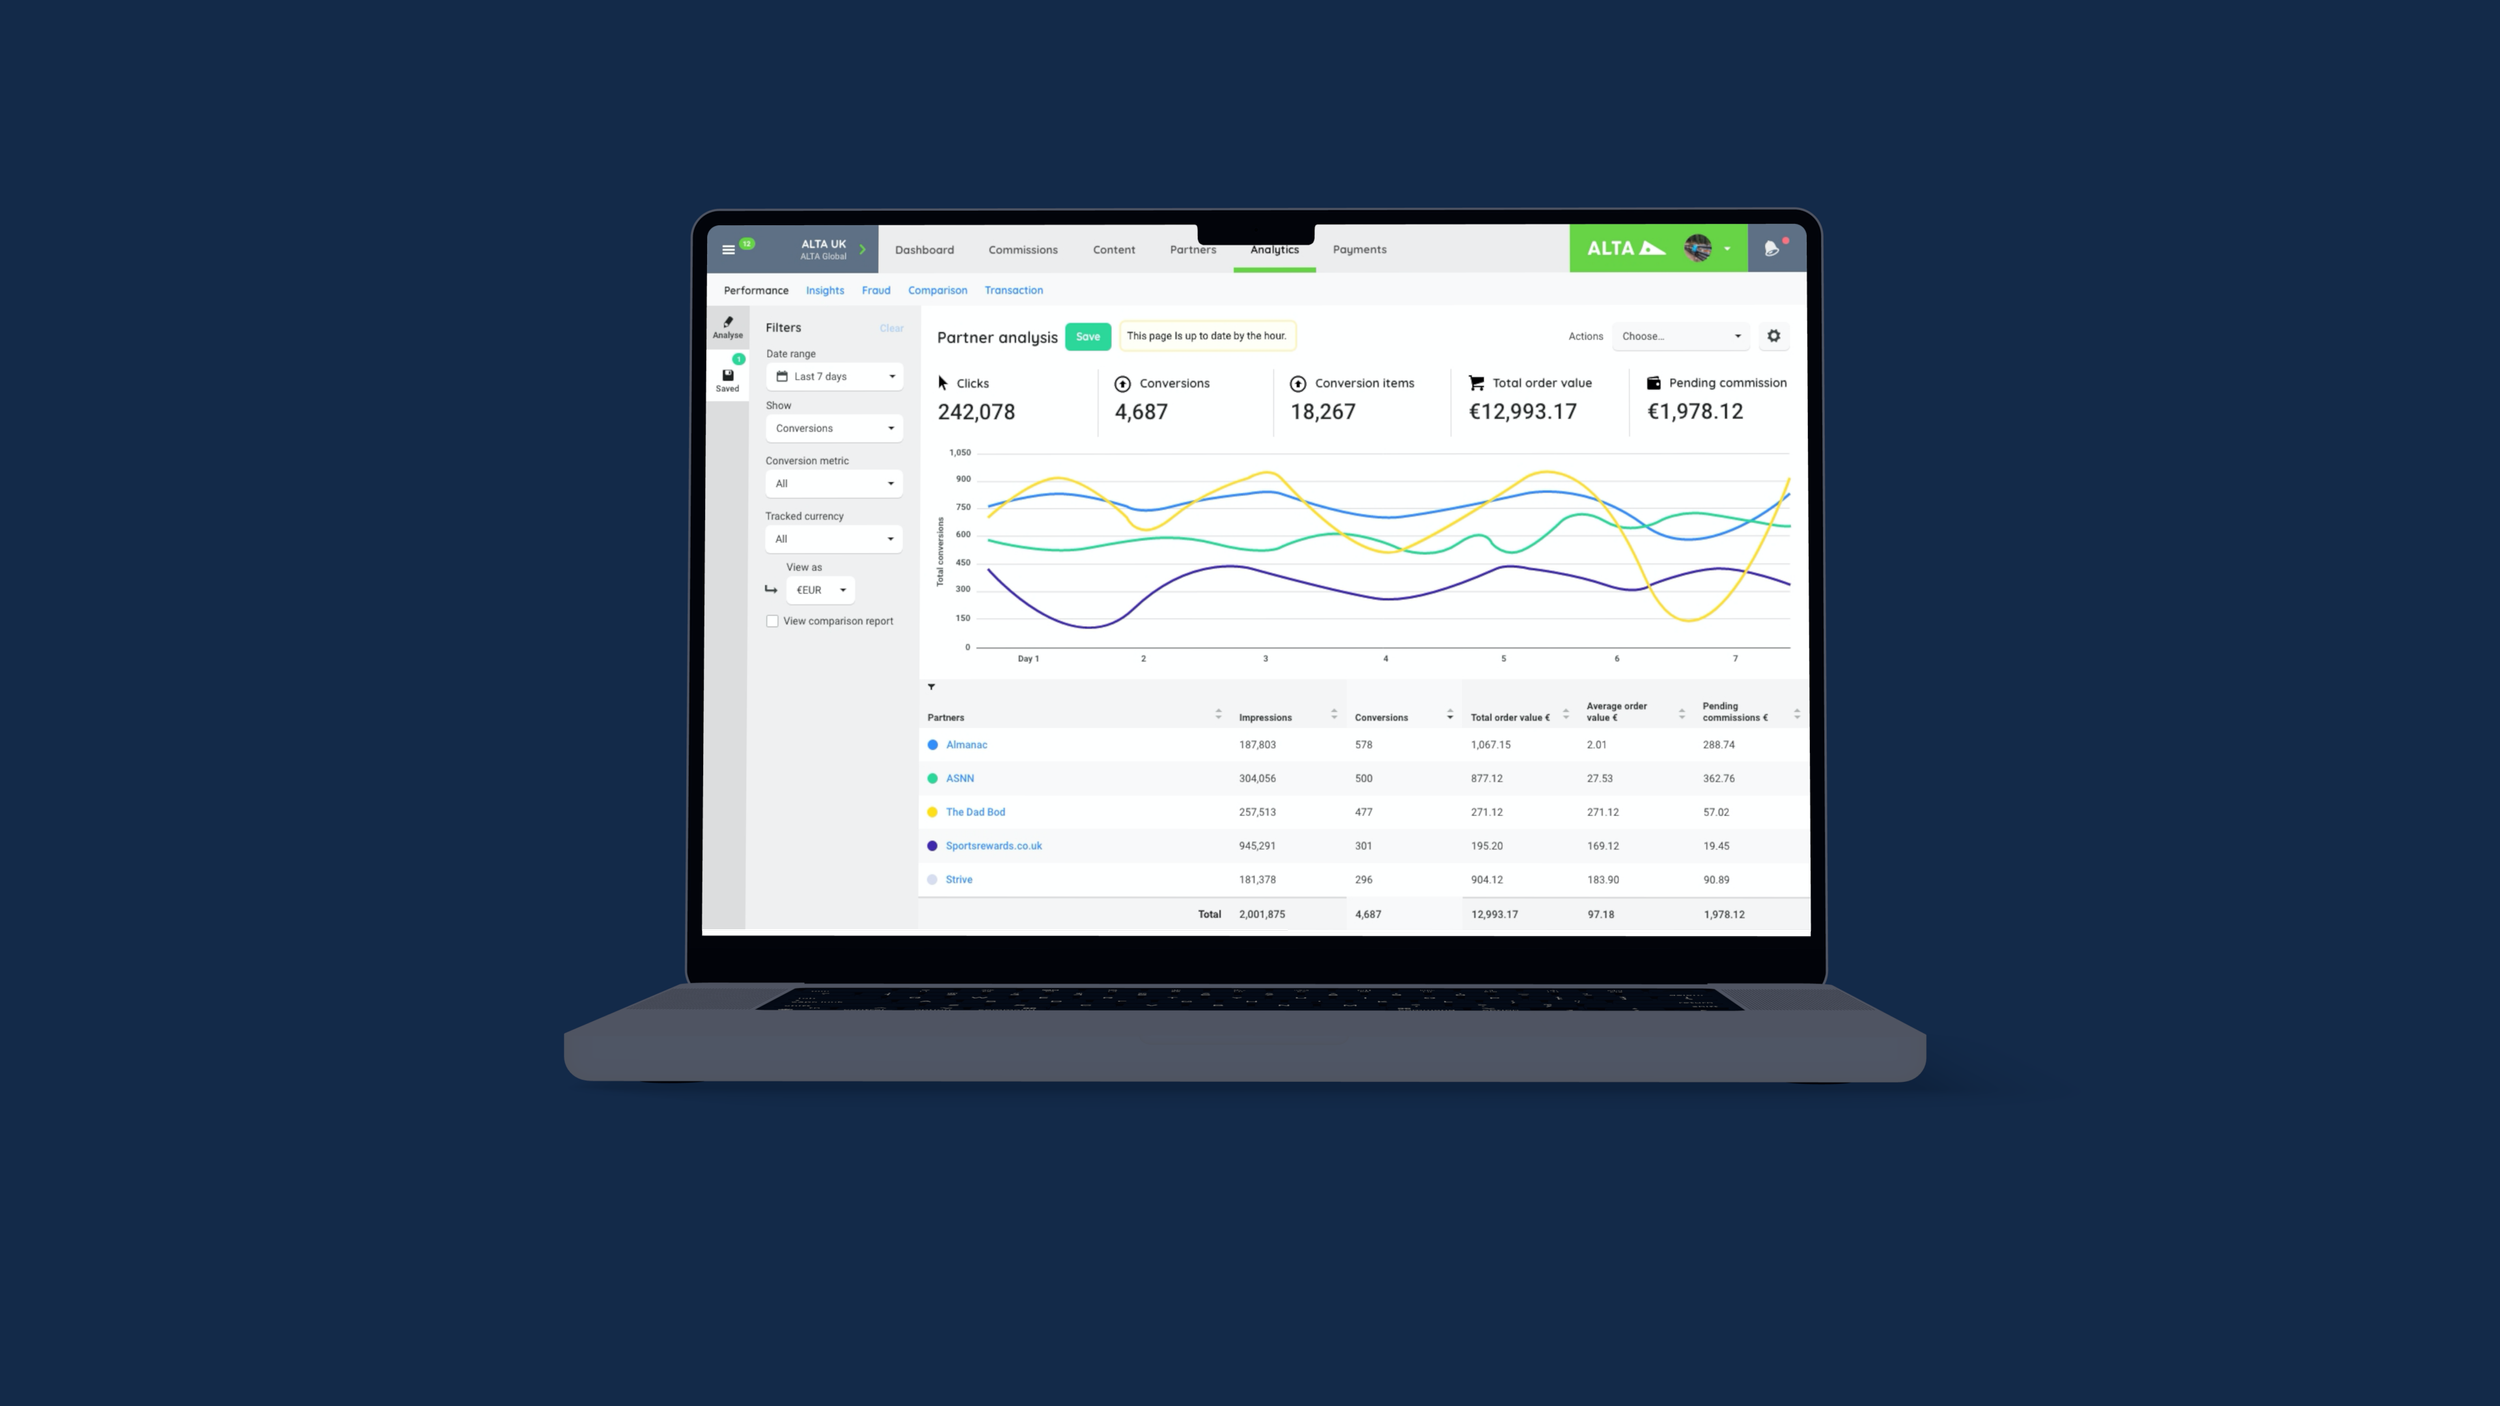
Partnerize Analytics.
V.2 FEATURE ETE
Full end to end design for the Analytics feature which focuses on introducing comparison reporting and prebuilt reports, as well as some huge fuctionality improvments to Partner Analysis and Transaction reporting.
-
The v.2 end to end for the analytics feature is designed to provide marketers with a comprehensive solution for analysing their affiliate campaigns.
With a focus on comparison reporting, customisable data views, and prebuilt report views, this feature aims to make it easier for marketers to gain insights into their campaigns and optimise their performance. We also made improvements to Transaction reporting and Partner analysis.
-
By comparing key metrics such as click-through rates, conversion rates, and revenue generated across different affiliate channels, marketers can identify the most effective strategies and adjust their campaigns accordingly. The customisable data views and prebuilt report views also provide flexibility and convenience, allowing marketers to quickly access the information they need and customise their reporting to suit their unique needs.
-
Competitor research, User research, ideation, sketches & wireframes based off company requirements and research, High fidelity Ui design for dev handoff.
‘Real-time analytics & actionable insights that power data-driven decisions for all our users’.
Analytics V.2
Users base
Affiliate marketing involves working with multiple partners/brands and channels, each with its own unique set of metrics and data points.
To cater to these very specific needs, and to compare metrics across channels, our user need to identify trends and patterns, quickly identifying areas of their campaigns that are underperforming or over-performing, allowing them to adjust their strategy accordingly.
Problem
Due to the wide range of users on the platform and the heavy data reports we often find that our users are overwhelmed, and often are unable to pull the data they need.
This can be particularly difficult for users who may not be familiar with data analysis tools or who may not have the time or resources to create custom reports. We also found that our users often wanted to compare data, wether that be time comparisons eg year on year or Partner analysis.
Solution
Prebuilt reports provide a concise overview of key metrics and trends, allowing users to quickly assess campaign performance without complex analysis.
Comparison reports include clear charts and graphs, highlighting essential insights. Together, these tools offer an accessible way to gain insights, make informed decisions, and optimise marketing strategies.
‘I wish there was a simpler way to view and compare my performance data. It would save me so much time and make it easier to see which campaigns are truly performing the best’
-New user
Design Process
1.
Discover
Surveys
Usability tests
Data analysis
User interviews
2.
Synthesis
Affinity mapping
Empathy maps
Personas
Journey maps
3.
Ideate
User flows
Card sorting
Wireframes
Lo-fi prototypes
4.
Design
High-fi designs
Component library
Branding ideation
Developer handover
Discover
The discovery stage of analytics v.2 was a critical step in the development process. This stage involved extensive research and analysis to identify the needs and requirements of users in relation to to partner analysis, comparison reporting, custom-built reports, and transaction reporting.
The team worked to identify key features and functionalities that would make the reporting feature more user-friendly and effective, while also ensuring that the platform is able to handle large volumes of data and complex reporting needs. This stage of the discovery stage was crucial to the success of the reporting feature, as it lay the foundation for the development process and helped to ensure that the final product met the needs of users and exceeds their expectations.
Research
Conducting face to face interviews with existing users of the platform provided us with valuable insights into their experience and usage of the platform. Through these interviews, we were able to understand their pain points, identify areas for improvement, and gather suggestions for new features.
The feedback we received helped us to identify two key areas for improvement: creating a comparison feature and updating and improving the existing transaction reporting and partner analysis features. By incorporating these suggestions, we were able to improve the usability and functionality of the platform, making it more user-friendly and efficient for our existing users.
Key results
70%
Of users regularly compare data by data, eg week on week, month on month and year on year.
65%
of our users found it took them longer than expected to retrieve the data they were looking for.
User flows and journey mapping.
Creating user flows involved identifying the steps a user would take to achieve their desired outcome while using the feature. This process required us to analyse the current platform from both the partner and brand side to ensure that the analytics feature serves the needs of both parties.
When creating user flows, it was important to consider the different user personas and the tasks they need to accomplish within the platform. By understanding the user's goals and behaviour’s, we designed intuitive user flows that guide users through the analytics feature, making it easy for them to access and interpret the data they need.


Transaction reporting
Transaction reporting allows users to track and analyse their performance metrics in real-time. Whether our users are looking to optimise their marketing strategies, track their earnings, or monitor their campaign performance. With the improved transaction reporting feature we can provide the tools and data necessary for our users to succeed in the competitive world of affiliate marketing.


